Building a Complete Observability Stack for Kubernetes
Kubernetes provides container orchestration, self-healing, and automatic scaling by default. However, it does not offer comprehensive visibility into application behavior at runtime. While a metrics API and container logs are available, integrating these into a unified observability framework, one that links latency spikes to specific traces and explanatory log lines, requires a carefully assembled stack of interoperable tools.
This gap is one that every team operating production Kubernetes environments must address. Although Kubernetes offers a robust platform for deploying and managing containers, it is not a traditional Platform-as-a-Service and does not include a pre-configured environment for monitoring, debugging, or application insight. Teams must assemble this environment independently, and these decisions directly impact the speed and effectiveness of diagnosing operational issues.
This post walks through one proven approach to building that observability layer: the tools involved, how they map to the four pillars of observability, and why the architecture looks the way it does.
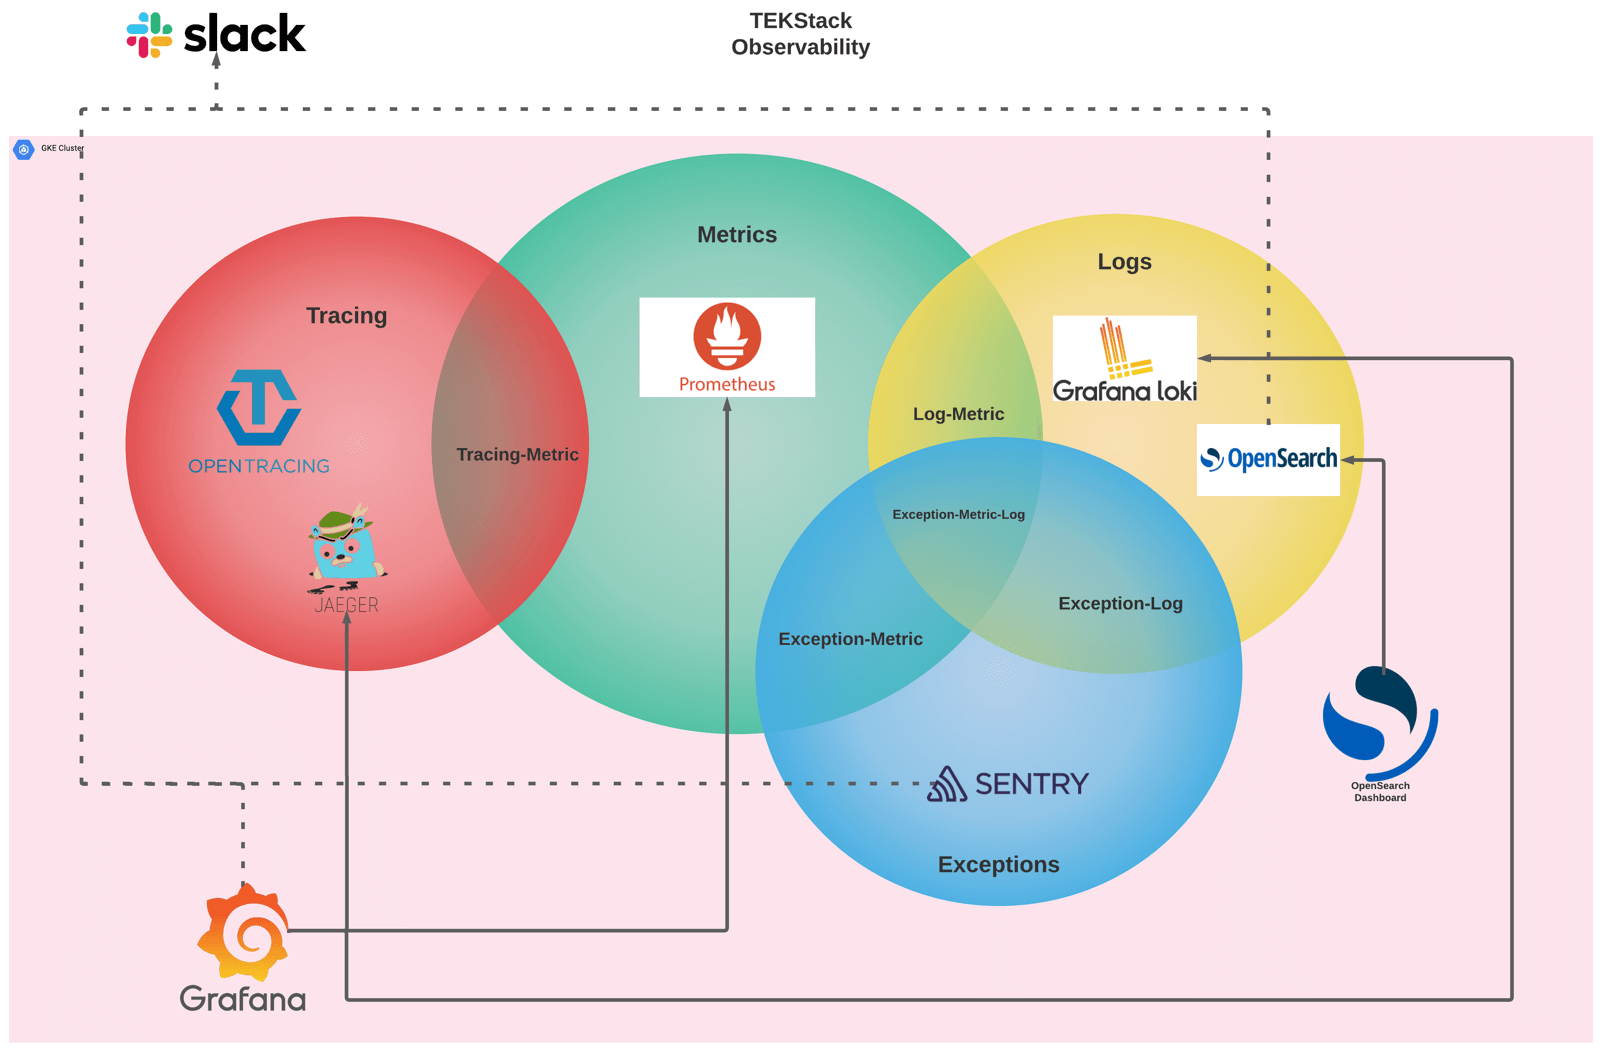
Four Pillars, Not Three
While most observability frameworks emphasize three pillars (metrics, logs, and traces). A more comprehensive strategy introduces a fourth pillar: exceptions. This approach treats exceptions as a primary signal type, complete with dedicated tooling and correlation mechanisms.
Here is how the architecture breaks down:

Metrics: Prometheus
Time-series metrics collection with Kubernetes-native service discovery, alerting rules, and the largest ecosystem of exporters.
Prometheus sits at the center of the metrics pillar. It scrapes endpoints exposed by your applications and Kubernetes infrastructure on a configurable interval, stores time-series data, and evaluates alerting rules. In a well-configured cluster, Prometheus uses Kubernetes service discovery, so any pod annotated for scraping is automatically picked up.
Prometheus addresses real-time operational questions such as request rate, error rate, latency percentiles, CPU and memory utilization, and queue depths. In most cases, when anomalies appear on a Grafana dashboard, Prometheus serves as the primary data source.
Logs: Grafana Loki and OpenSearch
Kubernetes-native log aggregation: indexes labels, not full text, for fast label-driven queries during incident response.
Full-text search, regex matching, and long-term log analytics with its own dashboard interface.
An effective observability stack incorporates two log backends to address distinct use cases. Grafana Loki is optimized for Kubernetes-native log aggregation, indexing labels instead of full text to minimize storage costs while enabling filtering by namespace, pod, container, or custom labels. For requirements such as full-text search, regular expression matching, or long-term log analytics, OpenSearch offers these functionalities along with its own dashboard interface.
These two systems are complementary rather than redundant. Loki supports rapid, label-driven queries commonly used during incident response, while OpenSearch is suited for more intensive analytical workloads, such as searching across extensive log datasets for unanticipated patterns.
Tracing: OpenTracing and Jaeger
Vendor-neutral instrumentation API that decouples application code from specific tracing backends.
Trace backend that collects, stores, and visualizes distributed traces with searchable UI.
Distributed tracing addresses the question of where time is being spent within a system, a perspective that metrics and logs alone cannot provide. When a user request traverses multiple microservices and experiences latency, tracing identifies the specific service contributing to the delay and pinpoints the downstream bottleneck.
OpenTracing provides a vendor-neutral instrumentation API that decouples application code from a specific tracing vendor. Jaeger serves as the trace backend, it collects, stores, and visualizes traces with a UI that lets you search by service, operation, tags, or duration.
The intersection of tracing and metrics, labeled “Tracing-Metric” in the architecture diagram, enables the derivation of RED metrics (Rate, Errors, Duration) directly from trace data. This integration allows users to investigate a spike on a Prometheus dashboard by accessing the corresponding Jaeger traces responsible for the anomaly.
Exceptions: Sentry
Application exception management: captures stack traces, groups incidents, monitors regressions, and notifies teams.
Sentry manages application exceptions as a distinct signal type, ensuring they are not obscured within general log data. Upon the occurrence of an unhandled exception, Sentry captures the complete stack trace, groups related incidents, monitors regression status, and notifies the appropriate team.
Treating exceptions as a separate signal accelerates the triage process. Rather than manually searching logs for stack traces, developers receive a prioritized list of errors, including frequency, affected users, and release associations. Sentry integrates with the other observability pillars through the overlapping regions in the architecture.
- Exception-Metric: exception counts and rates feed into Prometheus for alerting thresholds.
- Exception-Log: stack traces and contextual data are logged for correlation.
- Exception-Metric-Log: the full intersection where an exception event is visible as a metric anomaly, traceable in the logs, and captured with full context in Sentry simultaneously.
Grafana and Sentry: Nearly a Single Pane of Glass
Unified visualization platform natively integrating Prometheus, Loki, Jaeger, and OpenSearch via plugins.
Three of the four pillars converge within Grafana, which serves as the primary platform for visualization and exploration. Grafana natively integrates with Prometheus, Loki, and Jaeger, while the OpenSearch plugin enables access to the full-text log index. From a single Grafana dashboard, operators can identify metric anomalies, investigate contributing traces, and examine related log entries. Sentry operates as a separate dashboard for exception management. When an investigation requires checking exceptions, teams switch to Sentry’s own UI to review stack traces, incident grouping, and regression status.

Slack Integration and Alerting
Routes alerts from Prometheus Alertmanager and Sentry directly into team channels for workflow-native notifications.
The architecture positions Slack at the top of the stack, interfacing with the cluster boundary. Alerts reach Slack through two independent paths. Prometheus Alertmanager handles metric alerts (PromQL rules), log-based alerts (Loki Ruler evaluating LogQL rules), and trace-derived alerts, RED metrics (Rate, Errors, Duration) extracted from Jaeger spans via OpenTelemetry Collector are fed into Prometheus and alerted on like any other metric. Sentry uses its own built-in Slack integration to deliver exception notifications directly, bypassing Alertmanager entirely. Jaeger and OpenTracing have no native alerting capabilities; trace-based alerting is achieved exclusively through this span-to-metrics pipeline.
The objective is to eliminate the need for proactive dashboard monitoring; critical alerts are delivered directly to the appropriate channels.

Why This Architecture Works
This observability layer adopts a deliberately opinionated design. Instead of offering a broad selection of tools and leaving integration to individual teams, it prescribes specific solutions and ensures their seamless integration.
Prometheus for metrics because it is the Kubernetes-native standard with the largest ecosystem of exporters and recording rules. Grafana Loki for log aggregation because it shares Grafana’s label model and keeps storage efficient. OpenSearch for full-text log analytics when label-based querying is not enough. Jaeger for distributed tracing with OpenTracing instrumentation for vendor neutrality. Sentry for exception tracking because application errors deserve their own workflow, not just a log line. Grafana is the unified frontend because it natively supports all of the above as data sources.
The outcome is a cluster in which observability is integrated from the outset, rather than retrofitted after initial production incidents. This approach ensures cohesive configuration and establishes correlation paths among all signal types.
Related: Interested in how programming languages compare on aesthetics and code beauty? Check out the Beauty Index where 26 languages are scored across 6 dimensions — from visual geometry to conceptual integrity.